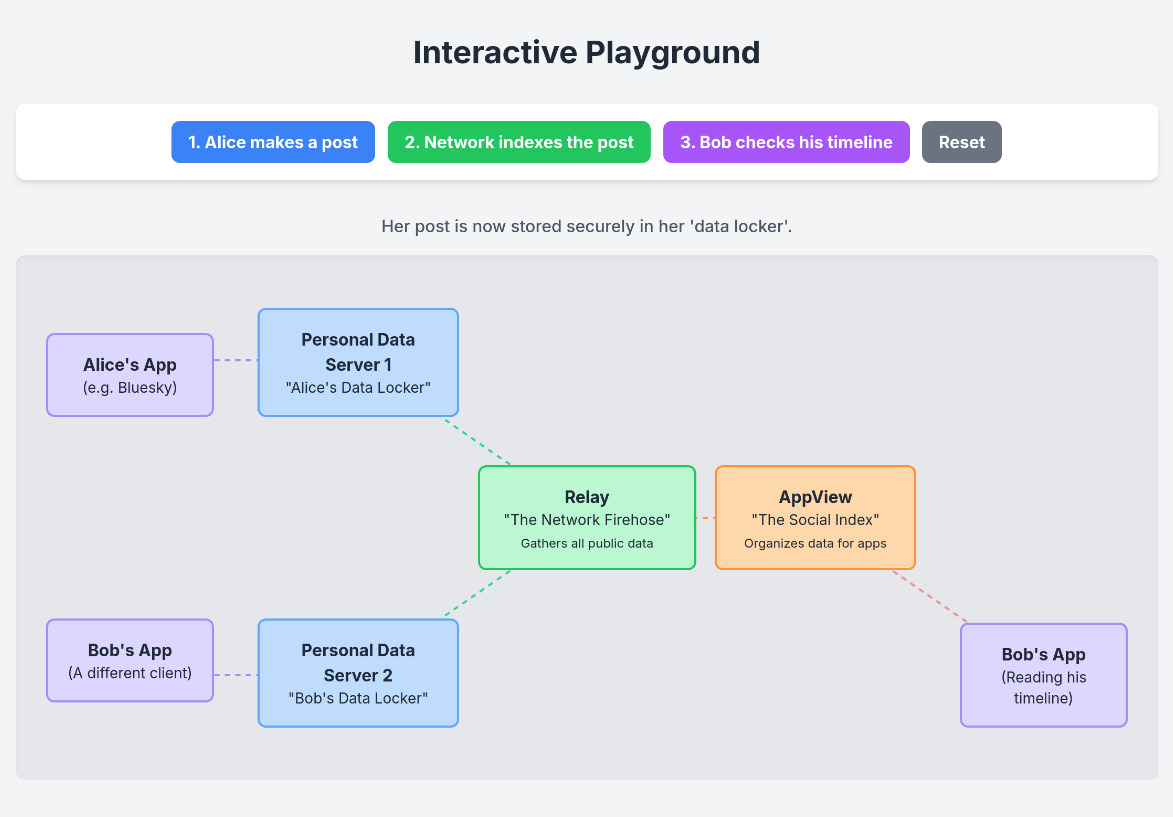
Turns out Gemini is very good at making visualisations in HTML - so I played around with a tool to visualise atproto and it’s open source on GitHub! Might help with explaining to average/new users? iirc some other similar tool may exist, but I forgot.
#atproto